
Table of Contents
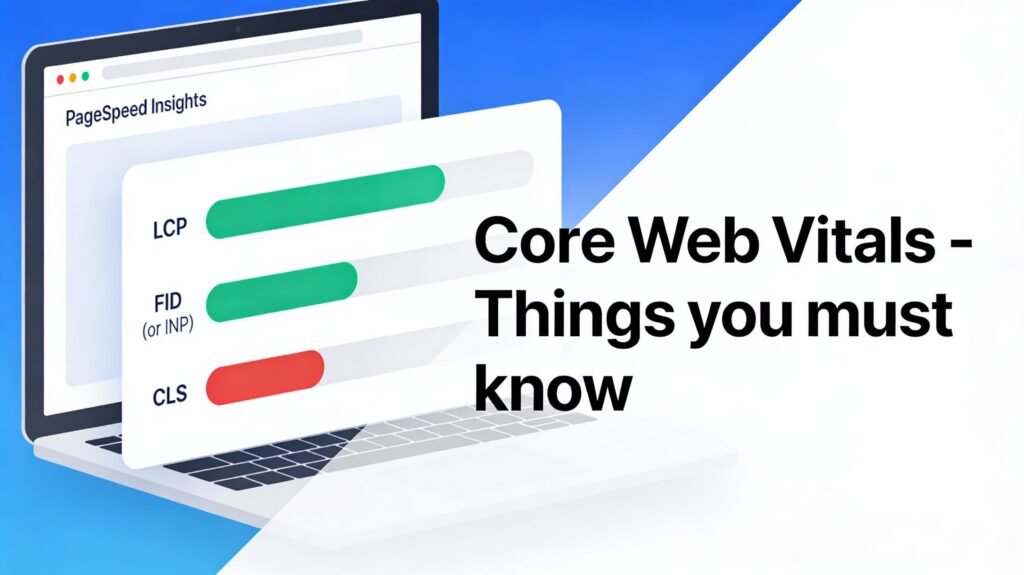
Core Web Vitals represent Google’s attempt to quantify user experience through measurable performance metrics. Introduced as official ranking signals in 2021, these three specific measurements—Largest Contentful Paint, Interaction to Next Paint, and Cumulative Layout Shift—evaluate how quickly content loads, how responsive your site feels, and how stable the visual experience remains.
Understanding and optimizing these metrics has become essential for maintaining competitive search visibility.
What Are Core Web Vitals
Core Web Vitals form a subset of Google’s broader Web Vitals initiative, which encompasses numerous user experience metrics. Google selected these three specific measurements as the most critical indicators of user experience quality, making them explicit components of search ranking algorithms.
The relationship between Core Web Vitals and overall site speed is interconnected—poor Core Web Vitals typically indicate broader performance problems that affect rankings through multiple pathways. For comprehensive insights into how performance impacts your search visibility, see our detailed guide on How Site Speed Affects SEO Rankings.
Largest Contentful Paint (LCP)
LCP measures loading performance by identifying when the largest content element becomes visible within the viewport. These metric attempts to capture the moment users perceive your page as “loaded” and useful, rather than measuring when the entire page finishes loading.
Google considers LCP good when it occurs within 2.5 seconds, needs improvement between 2.5 and 4 seconds, and poor beyond 4 seconds. The largest element is typically a hero image, heading, or large text block—whatever dominates the initial viewport when users first see your page.
Improving LCP requires addressing these root causes systematically. Optimize your server response time through better hosting, caching, and database optimization. Eliminate render-blocking resources by inlining critical CSS, deferring non-critical JavaScript, and breaking large files into smaller chunk.
Interaction to Next Paint (INP)
INP replaced First Input Delay (FID) in March 2024 as Google’s interactivity metric. While FID measured only the first user interaction, INP evaluates all interactions throughout the page lifetime, providing a more comprehensive assessment of responsiveness.
INP measures the time between user interactions—clicks, taps, keyboard inputs—and when the browser updates the display with visual feedback. Good INP occurs at 200 milliseconds or less, needs improvement between 200 and 500 milliseconds, and rates as poor beyond 500 milliseconds.
Improving INP requires optimizing JavaScript performance through code splitting to load only necessary code initially, breaking long tasks into smaller chunks that allow browser responsiveness, using web workers to offload processing from the main thread, and reducing unnecessary JavaScript execution.
Cumulative Layout Shift (CLS)
CLS measures visual stability by quantifying unexpected layout shifts during page loading. When elements move after initial render—images loading and pushing content down, ads appearing and relocating text, fonts swapping and changing layout—users experience frustration and sometimes click wrong elements accidentally.
Google considers CLS good at 0.1 or less, needs improvement between 0.1 and 0.25, and poor beyond 0.25. The score represents the sum of all unexpected layout shifts throughout the page lifecycle, with shifts during user interactions excluded.
Fixing CLS requires explicit dimension specifications for all images and video elements, allowing browsers to reserve appropriate space before content loads. Reserve space for dynamic content like advertisements by using fixed containers that prevent layout shifts when ads load. Use font-display: optional for web fonts to prevent text reflow, or ensure fallback fonts closely match final font metrics.
Measuring Core Web Vitals
Multiple tools provide Core Web Vitals data through different lenses. Google Search Console’s Core Web Vitals report shows field data from real Chrome users visiting your site, grouped by mobile and desktop. This real-world data reflects genuine user experience across varying devices, networks, and geographic locations.
PageSpeed Insights combines lab data from Lighthouse testing with field data from CrUX, offering both controlled measurements and real-user metrics. Use lab data for development and debugging since it provides immediate feedback, but prioritize field data for understanding actual user experience.
Chrome DevTools allows real-time monitoring while browsing your site, useful for diagnosing specific issues during development. The Performance panel identifies long tasks affecting INP, layout shifts causing CLS problems, and loading bottlenecks impacting LCP.
Core Web Vitals as Ranking Factors
Core Web Vitals influence rankings as part of Google’s page experience signal, but they don’t override content quality or relevance. A page with mediocre Core Web Vitals but exceptional content can still outrank pages with perfect metrics but poor content.
For a systematic approach to evaluating your Core Web Vitals alongside other technical factors affecting search performance, follow our comprehensive Technical SEO Audit Checklist that covers every critical element.
The Bottom Line
Core Web Vitals provide concrete, measurable targets for improving user experience in ways that directly correlate with search rankings and business outcomes. While achieving perfect scores across all metrics isn’t required for ranking success, ensuring your pages meet minimum thresholds prevents performance from limiting your organic visibility.
Monitor your metrics continuously, as performance naturally degrades over time as you add features and content. Establish performance budgets preventing new additions from pushing you below acceptable thresholds.
Remember that Core Web Vitals connect to broader site speed and technical health issues—optimizing these specific metrics often requires addressing fundamental performance problems that benefit user experience beyond just the measured metrics.
Leave a Reply